(Source: U.S. Census Bureau, New Hampshire Secretary of State)
Total Population, April 1, 2000 1,235,786
Voting Age Population, Nov. 2000 911,000 % change from '96 +4.8
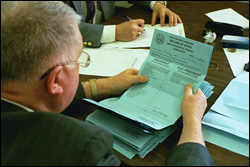
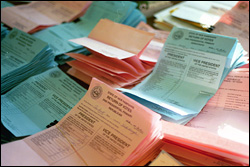
Total Registration, Nov. 2000 854,695 (includes 65,428 same day)
Rep. 301,844 (35.2%) Dem. 224,295 (26.2%) Undecl. 328,556 (38.4%)
New Hampshire has: 10 counties.
Five largest counties: Hillsborough, Rockingham, Merrimack, Strafford, Grafton.
Five largest cities: Manchester, Nashua, Concord, Derry, Rochester.
Government
Governor: Jeanne
Shaheen (D) up for re-election in 2000.
State Legislature: New
Hampshire General Court House: 152D, 241R, 1I,
6v
Senate: 12D,12R
Local: Cities
and Towns NACO
Counties
U.S. House: 2R
- 1.
J.Sununu (R) | 2. C.Bass (R).
U.S. Senate: Bob
Smith (R) up for re-election in 2002, Judd
Gregg (R) re-elected in 1998.
| Changes
as of the November 2000 Elections Governor: Jeanne Shaheen (D) re-elected, defeating former Sen. Gordon Humphrey (R) 48.74% to 43.76% with state Sen. Mary Brown (I) at 6.36%. State Legislature: Republicans gained a one-seat majority in the Senate and increased their margin in the House. House 141D, 257R, 1I, 1v Senate: 11D, 13R. U.S. House: Both members re-elected. |
 The Granite State |
Secretary of State
Libertarian
Party of NH
Natural
Law Party-NH
NH
Democratic Party
NH
Greens
NH
Republican State Comm.
Reform
Party of NH
Constitution
Party-NH